9/3/18

Drawing SVG paths in Python (expanding svg beyond web design) for PyGame, Tkinter, & Turtle

I HAVED MOVED THIS ARTICLE TO MY NEW BLOG HERE

Python has always had a rich GUI and graphics options. Some of them built-in such as Tkinter and Turtle Graphics, and also other modules like PyGame, PyOpenGL, Matplotlib.

The Web which started off with fairly primitive graphics ability with animated gifs, images, and java applets, but now has dynamic JavaScript, CSS, and especially Scaled Vector Graphics (SVG).

SVG Paths are particularly great for defining curving paths that combine lines, ellipses, cubic and quadratic Biezer curves.

I will show you a package for python that will allow you to draw paths in PyGame, TKinter, and with Turtle Graphics:

The all use the svg.path package that can be installed with pip install svg.path or pip3 install svg.path. (See svg.path · PyPI )

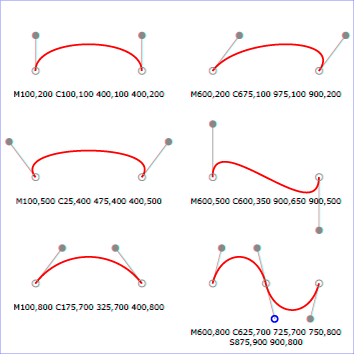
This library allows you to draw paths with lines, cubic and quadratic beizer curves, and ellipses. It will create a path by a series of method calls, or by using a path string as specified for the SVG d attribute for CSS: (see Mozilla SVG curves tutorial)

Quadratic Path:
Cubic Path:
Ellipse (Arc) Path:
To use the svg.path package for drawing d attribute path strings:

from svg.path import Path, Line, Arc, CubicBezier, QuadraticBezier, parse_path
d = "M100,200 C100,100 250,100 250,200 S400,300 400,200"
p = parse_path(d)

The code above would define a path object named x that would represent the path defined by the string in d. This path defines a move to 100,200 and then two cubic curves:

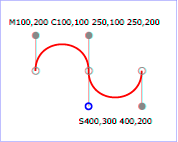
Red Curve Shows Path
Now that we have a path object:

x

we can call the point method to get a x,y position on the path expressed as a python complex number for a percent distance along the path expressed as a fraction from 0.0 to 1.0.

p x.point(0.5)

would return the point half way along path: (250+200j)

p2 = (p.real, p.imag) would convert the complex number to a tuple (250, 200) representing the x and y values referenced by p2.

Now complete code to render path to PyGame Window (associated video):

 
from __future__ import division # we need floating division
from svg.path import Path, Line, Arc, CubicBezier, QuadraticBezier, parse_path
import pygame
""" demo of using a great python module svg.path by Lennart Regebro
see site: https://pypi.org/project/svg.path/
to draw svg in pygame
"""
from svg.path import Path, Line, Arc, CubicBezier, QuadraticBezier, parse_path
svgpath = """m 76,232.24998 c 81.57846,-49.53502 158.19366,-20.30271 216,27 61.26714,
59.36905 79.86223,123.38417 9,156
-80.84947,31.72743 -125.19991,-53.11474 -118,-91 v 0 """
path = parse_path(svgpath)
# svg.path point method returns a complex number p, p.real and p.imag can pull the x, and y
# # on 0.0 to 1.0 along path, represent percent of distance along path
n = 100 # number of line segments to draw
# pts = []
# for i in range(0,n+1):
# f = i/n # will go from 0.0 to 1.0
# complex_point = path.point(f) # path.point(t) returns point at 0.0 <= f <= 1.0
# pts.append((complex_point.real, complex_point.imag))
# list comprehension version or loop above
pts = [ (p.real,p.imag) for p in (path.point(i/n) for i in range(0, n+1))]
pygame.init() # init pygame
surface = pygame.display.set_mode((700,600)) # get surface to draw on
surface.fill(pygame.Color('white')) # set background to white
pygame.draw.aalines( surface,pygame.Color('blue'), False, pts) # False is no closing
pygame.display.update() # copy surface to display
while True: # loop to wait till window close
for event in pygame.event.get():
if event.type == pygame.QUIT:
exit()

Now code for tkinter window:

# This examples runs only in python 3.+ versions since Tkinter was changed
from svg.path import Path, Line, Arc, CubicBezier, QuadraticBezier, parse_path
from tkinter import Tk, Canvas, Frame, BOTH
""" demo of using a great python module svg.path by
Lennart Regebro see site: https://pypi.org/project/svg.path/
to draw svg in Tkinter
"""
from svg.path import Path, Line, Arc, CubicBezier, QuadraticBezier, parse_path
svgpath = """m 76,232.24998 c 81.57846,-49.53502 158.19366,-20.30271
216,27 61.26714,59.36905 79.86223,123.38417 9,156
-80.84947,31.72743 -125.19991,-53.11474 -118,-91 v 0 """
path = parse_path(svgpath)
# svg.path point method returns a complex number p, p.real and p.imag can pull the x, and y
# # on 0.0 to 1.0 along path, represent percent of distance along path
n = 100 # number of line segments to draw
# pts = []
# for i in range(0,n+1):
# f = i/n # will go from 0.0 to 1.0
# complex_point = path.point(f) # point(x) is method on svg.path to return point x * 100 percent along path
# pts.append((complex_point.real, complex_point.imag))
pts = [ (p.real,p.imag) for p in (path.point(i/n) for i in range(0, n+1))] # list comprehension version or loop above
class SVGcurve(Frame):
def __init__(self, pts):
super().__init__()
self.pts = pts
self.initUI()
def initUI(self):
self.master.title("svg")
self.pack(fill=BOTH, expand=1)
canvas = Canvas(self)
x0, y0 = self.pts[0]
for x1, y1 in self.pts[1:]:
canvas.create_line(x0, y0, x1, y1)
x0, y0 = x1, y1
canvas.pack(fill=BOTH, expand=1)
root = Tk()
ex = SVGcurve(pts) # convert i_pts to (x,y) tuple list
root.geometry("400x600+300+300")
root.mainloop()

Now code for turtle graphics window (note in turtle graphics curve is flipped vertically since the y axis is positive in the upper direction:

from __future__ import division # for running in 2.7+ python
from svg.path import Path, Line, Arc, CubicBezier, QuadraticBezier, parse_path
import turtle
""" demo of using a great python module svg.path by Lennart Regebro see site: https://pypi.org/project/svg.path/
to draw svg in Tkinter
"""
svgpath = """m 76,232.24998 c 81.57846,-49.53502 158.19366,-20.30271 216,27 61.26714,59.36905 79.86223,123.38417 9,156
-80.84947,31.72743 -125.19991,-53.11474 -118,-91 v 0 """
path = parse_path(svgpath)
# svg.path point method returns a complex number p, p.real and p.imag can pull the x, and y
# # on 0.0 to 1.0 along path, represent percent of distance along path
n = 100 # number of line segments to draw
# pts = []
# for i in range(0,n+1):
# f = i/n # will go from 0.0 to 1.0
# complex_point = path.point(f) # point(x) is method on svg.path to return point x * 100 percent along path
# pts.append((complex_point.real, complex_point.imag))
pts = [ (p.real,p.imag) for p in (path.point(i/n) for i in range(0, n+1))] # list comprehension version or loop above
t = turtle.Turtle()
s = turtle.Screen()
t.penup()
t.setpos(pts[0])
t.down()
for x,y in pts[1:]:
t.setpos(x,y)
s.mainloop()


HAVE FUN!
-- Professor Gerry Jenkins

5 comments:

  1. This comment has been removed by a blog administrator.

    ReplyDelete
  2. This comment has been removed by a blog administrator.

    ReplyDelete
  3. thank you. You are a great teacher

    ReplyDelete
  4. Hi Gerry. How would I save a bezier to a sag file without Tinker , PyGame etc. Just a basic svg file Thank regards

    ReplyDelete
  5. Sorry should read SVG file lol!

    ReplyDelete

Please comment or give suggestions for follow up articles